
Debugging Angular App in Visual Studio Code (VSCode) - Demo
As we already discussed in our previous demo session like with growing maturity our code becomes complex and difficult to debug. Then we come up with this debugger concept for both server and client side coding. In this video session 0009-25- Debugging Angular App in Visual Studio Code (VSCode) we will focus on angular app debugging.
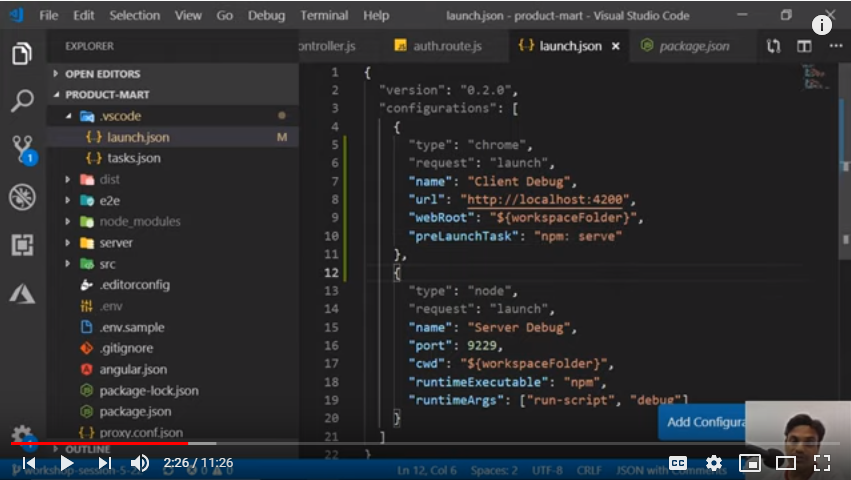
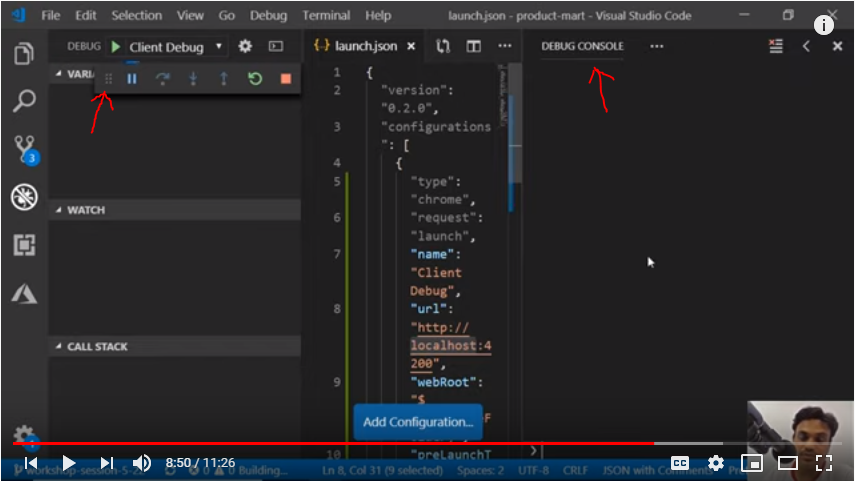
In order to debug our angular application, first we will see how to enable our code base for client side debugging. For this, we already created launch.json file in the VSCode in previous session. Here we will define all client side properties additionally, which will help us in angular app debugging.
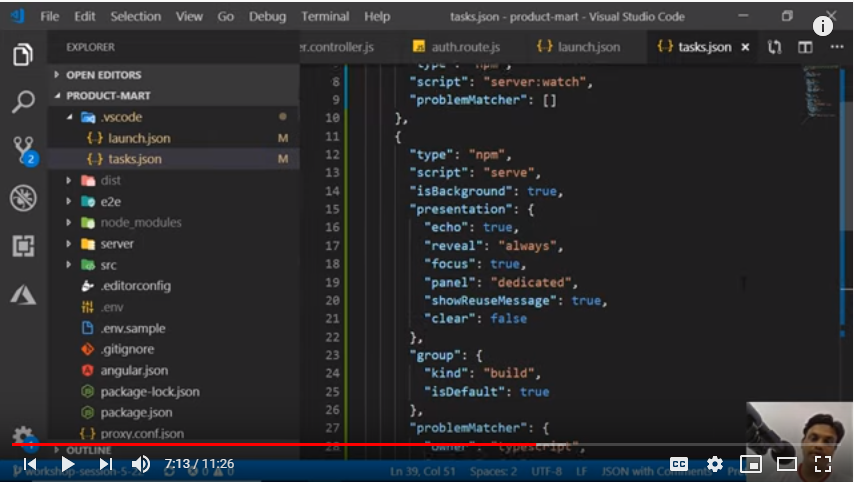
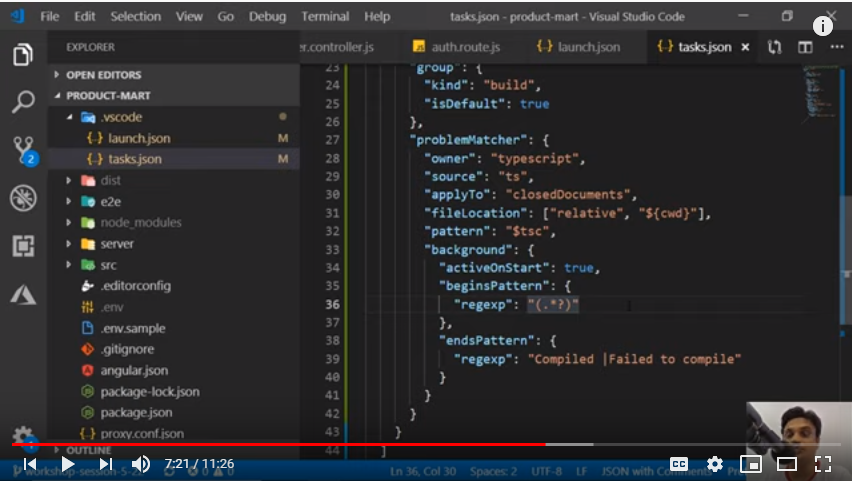
Also we need to define task for client side debugging by putting few more objects in task.json file.
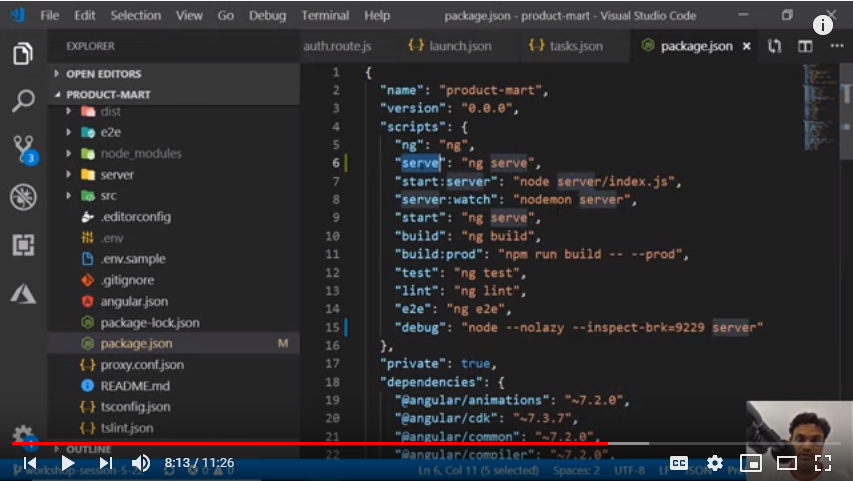
Next we will create “Serve” script in package.json file.
Now once we click on Client Debug button on top left corner, then debugger will be launched and we can see proceeding in Debug Console. Also we can check all the details at each function by putting checkpoints there.
So in this session we did hands on coding to create launch.json configuration object such that we can debug angular typescript code live in VSCode itself. No need to open chrome and hit F12 for debugging. Similarly we can configure our debugger to debug both client & server side codes together.